Data, data, data. I love data.
Homage to Ron Burgundy
Now that we have 5 minute interval sampling we’ve got LOTS of data. Here’s how the week started out charted in both Celsius and Fahrenheit for 7/26 to 7/27.
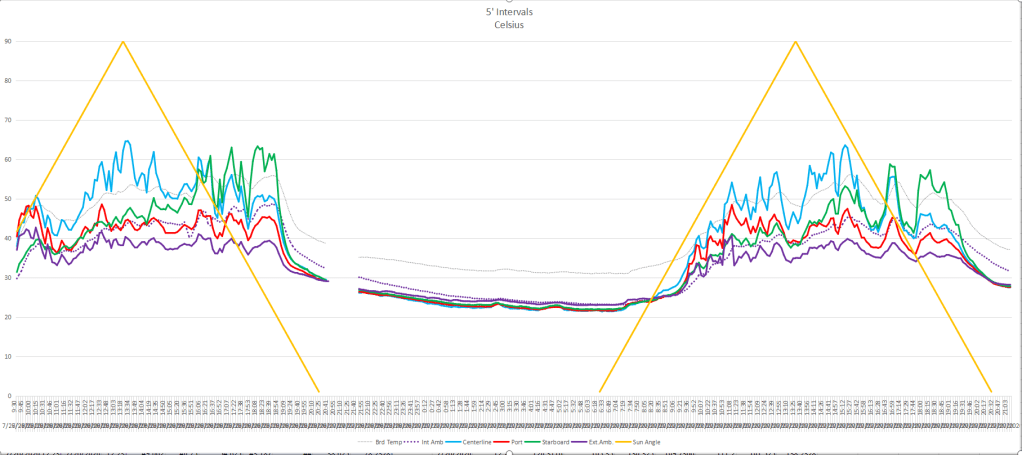
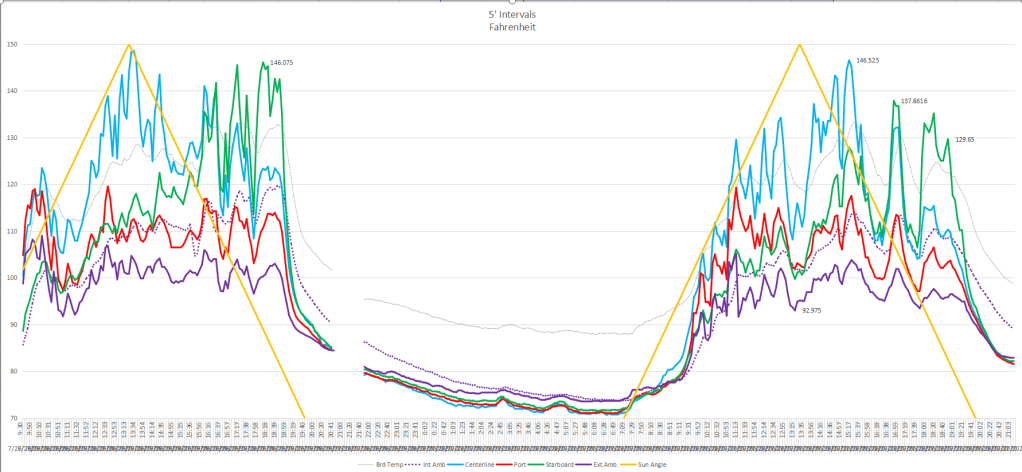
The first thing we noticed is that Fahrenheit de-clutters the data points making each line easier to read. Yes, we could have simply changed the range of the Celsius chart from 0 – 90 to 20 – 70 in order to “stretch” the data vertically but it was decided that the eventual two labelled y-axis chart might provide more flexibility for different viewers. Sadly, our version of spreadsheet program doesn’t allow for us to automatically display the equivalent Celsius scale on the right side of these charts but that’s okay. This reporting tool was never going to be a long term solution. The data really needs to be stored in a database instead of a CSV and a browser-based reporting tool hosted on a server will give us the flexibility to slice and dice our charts in real time. Great! Another two things to put on the “To-Do List”. Moving on.
All data will continue to be captured in Celsius by the BeagleBone Black but a parallel series of columns in the spreadsheet do the conversions to give us separate Fahrenheit cells, keeping us from overwriting the Celsius cells. Additionally, the sun angle cells had a little math done to them as well (+60) to allow them to line up in the same ranges as the temperatures. Let’s look at the data on that last chart and make some observations.
You may notice that our external ambient temperature (solid purple) is swinging wildly, almost in lock-step with the skin temperatures, especially the port side (red). That can’t be right. A 5 degree external ambient swing in as short as one 5 minute interval? Nope. What could be causing this? Time to run out there and put eyes, and hands, right on the problem.
As the sunset glow was still showing in the distance I did the typical red-neck thinking actions. Scratch my head, kick a dirt clod, lean against the container…Whoa! That metal is still pretty warm. Warmer than the 70 something degree or so ambient air. I thought, “wait, that should be expected, right? Sure, as the sun goes down and the external ambient cools, the metal can radiate it’s heat back into the air.”
Radiating, Heat…Radiating, Heat…
…Finkle, Einhorn…Finkle, Einhorn
Still scratching my head standing in the field next to the container I repeatedly moved my hand closer and farther away from the container’s west wall. “The air is hotter the closer I get to the metal? Of course it is. The metal is radiating it’s heat into the air.”
“Wait a tick,” picturing the chart in my head, “was the purple line above the red, green, and blue lines on the chart? After sunset?!? That can’t be right, could it? How could the metal be cooler than the “ambient air” temperature sensor? The metal is radiating it’s heat into the sensor!
Move the External Sensor away from the Metal
Although some of the heat being observed in the external ambient sensor (solid purple) can be attributed to the metal radiating its heat back out, it doesn’t account for the metal staying cooler than the ambient air throughout the night.
These sensors aren’t the most accurate. Plus, the external ambient sensor is different than the ones used inside the container. I used the self contained waterproof model outside versus the bare DS18 sensors on the inside. Maybe there’s a difference in accuracy between the two models? Something to keep an eye out for, but in the meantime, I’ve got to move that sensor away from the metal. Preferably into the shade of the north side of the container and maybe insulated from the metal with a piece of Styrofoam.
Note: the occasional glitch or outage happens, usually just because of a power outage or sometimes because the Beagle gets too hot (we think) and this causes the python script to stop because it thinks it can’t see a sensor. A reboot doesn’t work. I have to actually cycle the power. In the future we’ll just have to write in some error management capabilities so that it doesn’t crash when something unexpected happens. Unless it is the heat, in which case we really need to get a heat sink and fan installed soon.
7/26th, 27th, 28th
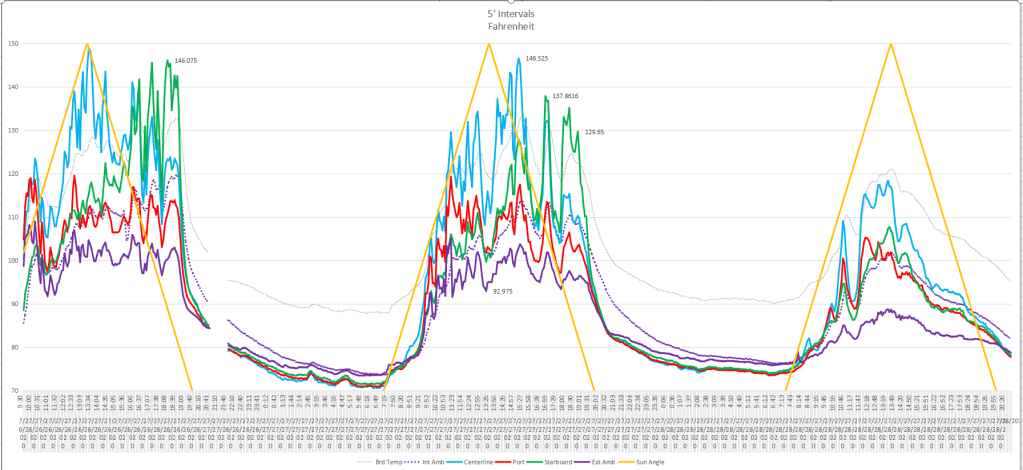
That’s better. Even though the 28th was a partly cloudy and cooler day, the external ambient line is no longer “spiking” with the skin temperature of that East OR West wall. See how the solid purple line is smoother throughout the day?
7/27th, 28th, 29th

Well, that settles one expected suspicion. The west side (green line) gets extremely hot, 20 to 30 degrees hotter, when the sun is baking right on it. Next week is supposed to be the longest stretch of 100 degree plus weather we’ve seen yet. Multiple days of data will confirm how much the sides and/or roof contribute to the overall internal temperatures throughout the day.
See y’all next week!
