P6
Proper Planning Prevents Piss Poor Performance
A saying I learned in the Navy but one I’m sure that’s used throughout all of the military. If I’ve learned anything by this little project it’s that it isn’t little anymore and it has the potential to continue growing exponentially in complexity, risk, time and costs. Not to mention, waste, if I’m not careful. Time to use something to provide for a little planning.
If you don’t geek out on Project Management like I do, feel free to jump down to “Let There Be Light” where we build a DIY solar panel with just one solar cell.
If You Fail to Plan, You’re Planning to Fail
As a project manager there are lots of ways of keeping track of what needs doing, by when, and by who. Even if it’s just you doing all the “doing”. Something as simple as a spreadsheet, although somewhat two dimensional, is better than nothing. Believe it or not, there are many tools available on the internet that are free or extremely cheap. What “Mom & Pop” can’t afford $5 or $10 per month for a little To-Do tracker, forethought, and peace of mind. As a project manager who cut his teeth on Microsoft Project over 30 years ago I’ve tried every tool under the sun. It also seemed that every company I worked for wanted to use something different. At the end of the day they all boil down to a simple To-Do list. What needs to be done, who’s going to do it, and when is it due? Everything else is gravy, icing, or bells and whistles. It just depends on how many bells and whistles you need, want, or can afford.
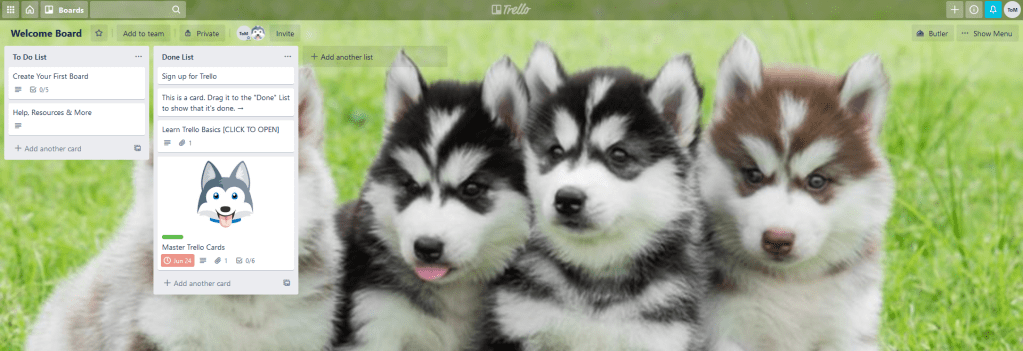
For most people starting out I recommend Trello.com. A simple, yet extremely effective, Team collaboration task manager. The basic version is still free. Tasks are created as “cards” on lists that you can drag from one status (To-Do) to another (Done). You can even create your own lists depending on the workflow used for the process you’re running. For example, a construction business might use lists (columns) like To-Do, Purchase Supplies, Gather Tools, Perform Task, Ready for Inspection, and Done. But it’s totally customizable and yes, you can change the background to whatever you want. The puppies are just a default as Trello’s logo and mascot is a Husky.
For a little more horsepower and customization, I prefer Jira. Also owned by Atlassian.com it comes in two flavors. One you can host on your own servers for companies who need that sort of thing. And a cloud-based version hosted by Atlassian so you don’t have to. It’s also free for up to 10 users but the free version is limited in its options and ability to be customized. Most find that by the time they’ve outgrown the free version and need more functionality, they can afford the measly $10 per month. It’s like trying it before buying it.
What makes Jira better than Trello in my opinion is its ability to create separate specific projects from templates depending on the type of project. It’s turn-key and you can be up and running in literally 15 minutes. I even have a Blog Project for tracking what blog articles I plan on writing, what I need to do to get all the content I need for them (sub-tasks), and a workflow to track and manage their progress.
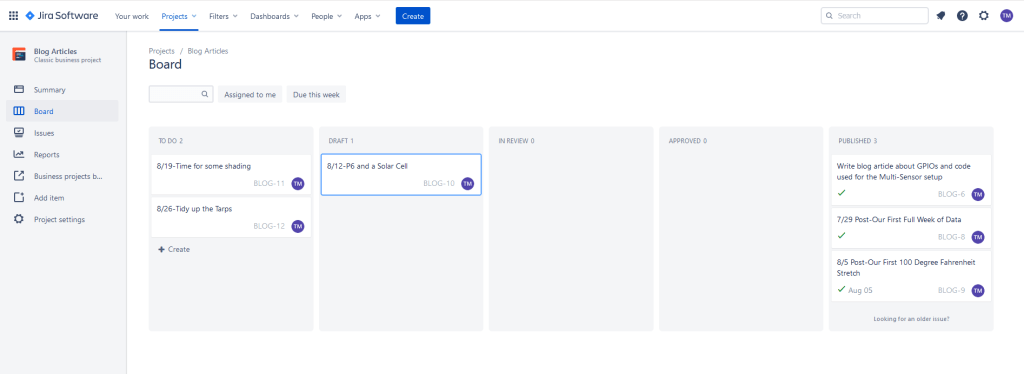
Because blogging goes through a draft-review-publish process I chose the simple Classic Business Project template which uses “To-Do”, “Draft”, “In Review”, “Approved”, and “Published” statuses. As I finish work on a step I just drag and drop it to the next column. As you can see, I’m a little behind on drafts for my next couple of posts. ![]()
Anywho, if you have any questions regarding this or any other planning tool, don’t hesitate to drop me a question. Most of the Free tools out there like this one “encourage” users that they’re better starting off with the paid solution. Or worse, they go as far as “hiding” (kinda) the free version from easy view. Don’t fall for these tricks. I believe strongly in the ability to “try before you buy” and that the expense for a new tool or its increased capability should be on the back of the profits it helped you create. In other words, if you’re a small business and you start out with the $10 per month per tool option, the tool(s) should help you grow your profits and stability you need to get “off the ground”. That way, once you get to the 11 to 25 employee level, which can costs hundreds or thousands, you can afford it. Then the added capabilities help take you to the next level.
“All Great Solutions Can Scale Easily.
If not, it’s not a great solution.”
Let There Be Light
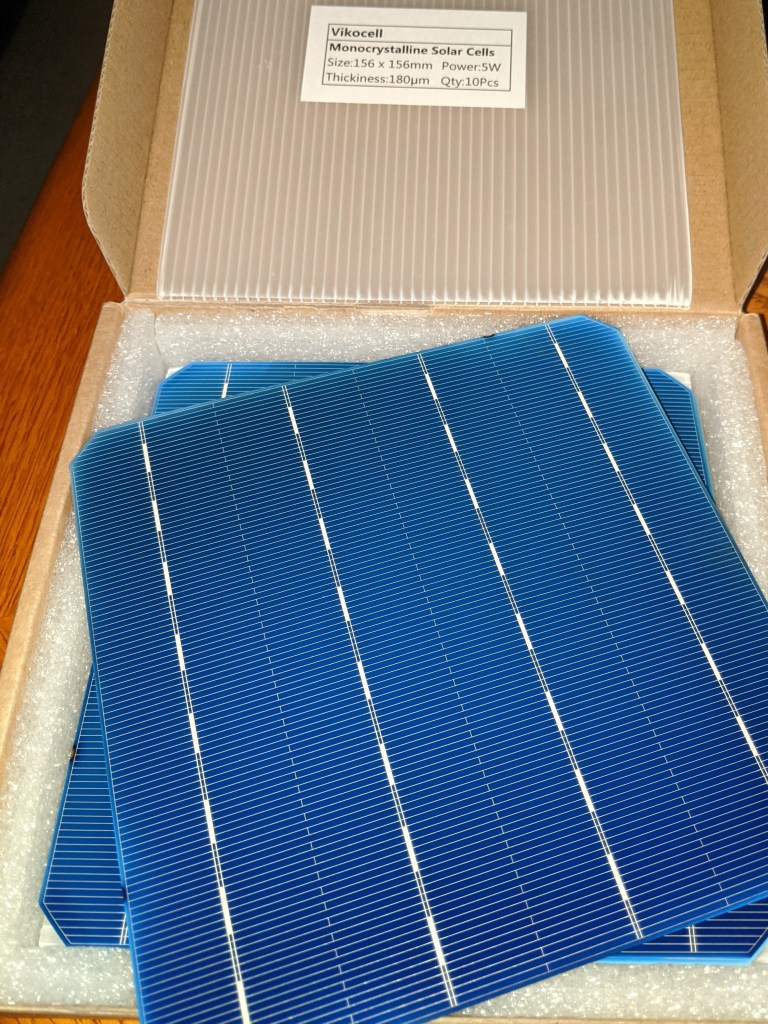
For a few bucks a piece I ordered a box of 10, 0.5 volt 5Watt monocrystalline solar cells. In retrospect, getting mono instead of polycrystalline may have been a mistake, as you’ll soon see from the chart data.
As we just finished the previous section on planning, here’s what we have to accomplish:
- Solder the leads to the back and front of a solar cell
- Break a few while practicing soldering the leads to the cell (they’re VERY fragile)
- Connect the solar cell to a different Beaglebone Black board so I don’t have to take the temperature sensor board offline yet
- Refine the existing sensor code to capture the solar cell’s analog voltage (the temperature sensors are digital)
- Mount everything to a ceramic tile to keep from flexing and breaking the cell
- Test the cell’s output voltage with a desk lamp
- Affix a piece of clear plexiglass with standoffs to protect the solar cell
- Seal the gap and edges with silicone to make it waterproof
- Test the cell’s output voltage outside in the sun
- Wire the solar cell with two wires from a length of CAT5 cable and put a connector on the end
- Take the temperature sensor Beagle offline
- Remove the Beaglebone Cape and de-solder one of the temperature sensor connector jacks
- Solder new wires for this jack to one of the analog ports on the cape
- Reconnect the cape and connect the solar cell connector to the new jack
- Test the solar cell is sending a voltage signal to the board
- Mount the ceramic tile solar cell to the roof of the container and route the connector inside
- Reconnect everything, power it up, and verify this new data column is being added to the CSV file
Whew! Now do you see why a planning tool is a good idea? This part of the project alone showed me I need to have at least one, probably two, complete extra Beagle setups for testing new configurations, sensors, coding, or as a replacement should the main one fail.
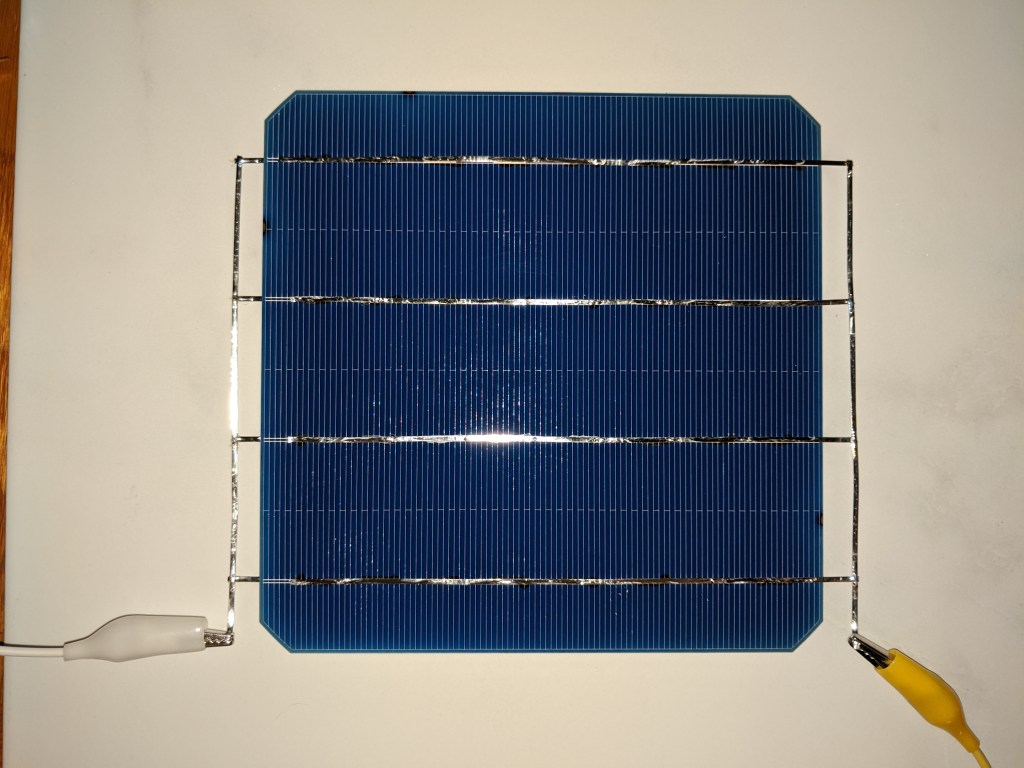
It’s hard to make out in this picture but the leads soldered to the top of the cell (positive) only connect to the clip on the right. Whereas all of the leads soldered on the back (negative) connect to the clip on the left.

Even though it’s only rated for 5 watts at half (0.5) a volt, in the bright sunlight it easily cleared 0.62 volts. I’m told this is typical of new monocrystalline cells but that they do come down when they get hot and that they degrade a bit over time.
Why are solar cells less effective when they get hot? Because they get really hot! In just 45 minutes the back of the ceramic tile was so hot in the center I couldn’t hold it but by the edges. And ceramic tiles are supposed to be terrible conductors!
But seriously, why do they lose their output voltage? Well, the increase in the cell’s temperature increases its resistance, and this reduces its output voltage. Which I had anticipated. We had to know whether a cloud or heat was causing a reduction in the cells output voltage, so we mounted another waterproof temperature sensor to the bottom of the ceramic tile. Wait til you see the temperatures coming off the back of this thing!
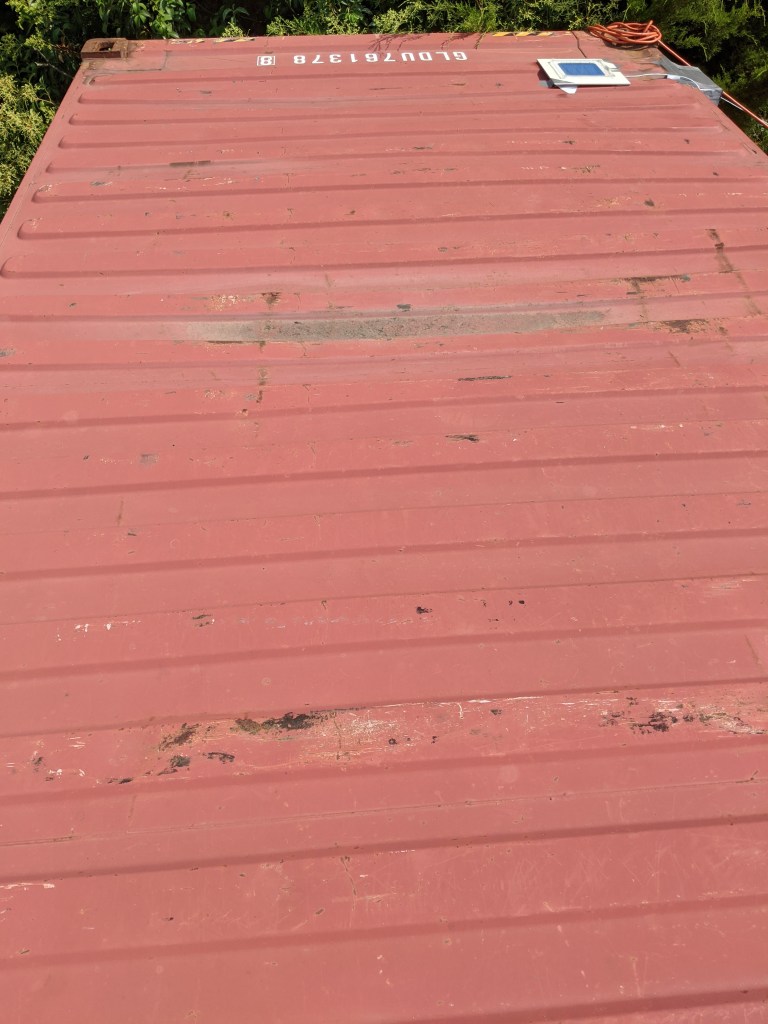
We mounted the tile to the top of the container near the openings where all the other wires went in. Straddling the ridges in the container roof we had hoped to provide some ventilation for the temperature sensor underneath the tile. Sadly, the sensor received heat from the solar cell heated tile AND the metal roof. We’ll have to move the cell or put it on a pole or something.
As I mentioned earlier, the use of a moncrystalline cell might have been a mistake. They’re made from a single crystal, hence the name, and this makes them very efficient and especially resilient to partial shading (almost complete actually). It was like a light switch, either “on” or “off”, resulting in a graph that looked like a butte or a mesa.

Straight up as soon as the sun was out, no matter how little, and straight down only once the last bit of sun was gone. The current amperage would drop a little but the voltage stayed very steady at half a volt or better except on the most cloudy of days where it would dip slightly downwards and then right back up.
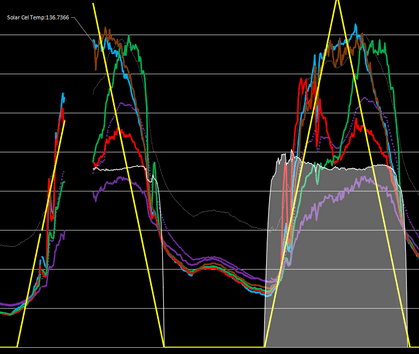
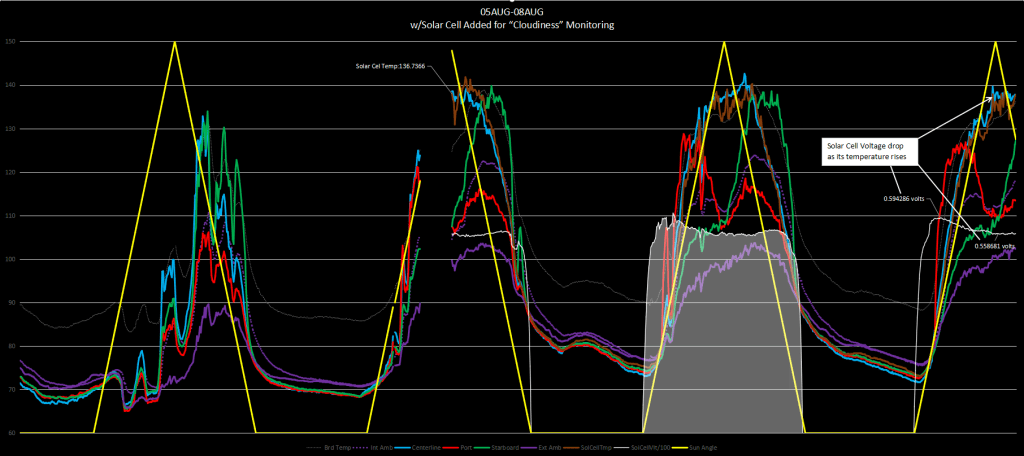
This first charting simply took the output voltage and multiplied it by 100 to get it to show above the 50 degree line on the graph. You should also notice the ceramic tile temperature sensor is now the hottest thing we’re tracking starting at 136 degrees.
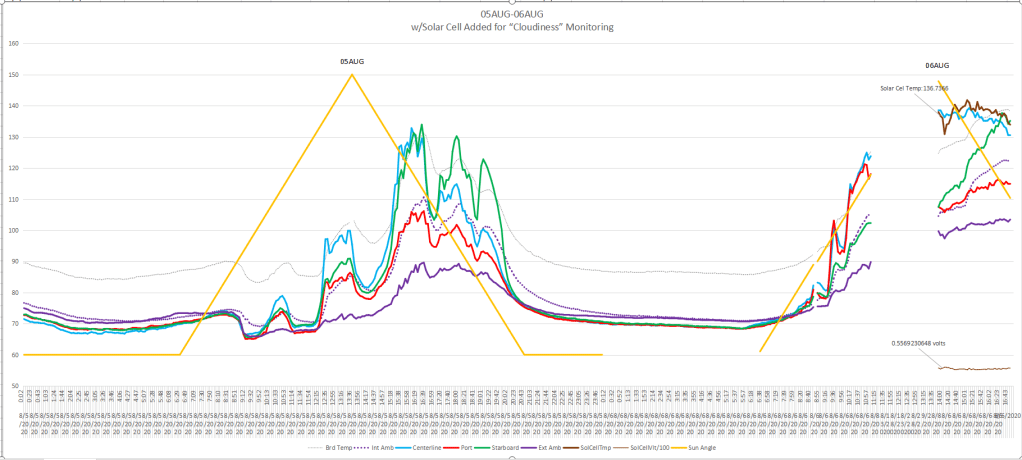
Making a few more “maths” adjustments to the cell output voltage spreadsheet entry, changing its color to white, and changing the chart’s background color to black for contrast and viola!
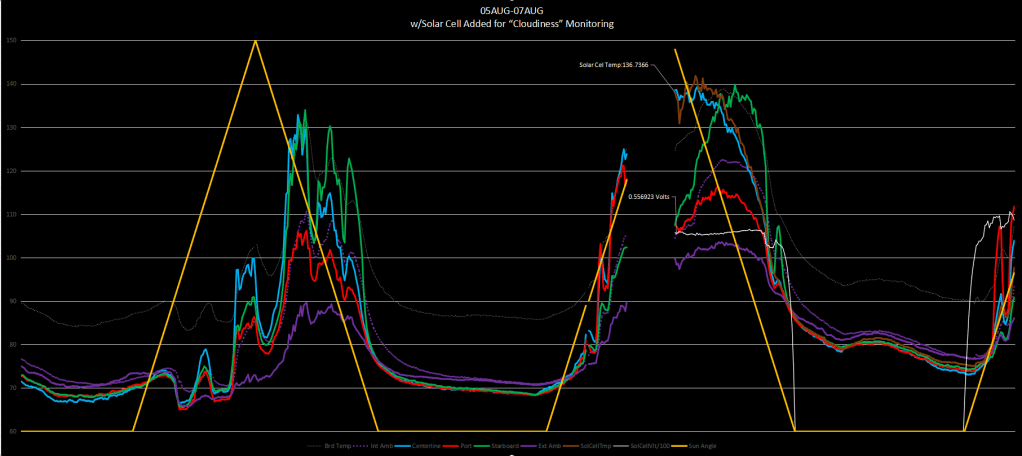
The white “butte” is a little more obvious in this chart starting off at approximately 105, dipping a little around the time the green temperature does, and then falling off completely, joining the yellow line of the sunset at the bottom of the chart. Notice the white line shooting back up right at sunrise on the next day? Monocrystalline, just like a light switch.
A few more days of data gathering and now the pattern is obvious. The solar cell voltage “sags” as its temperature rises throughout the day.
The good news is the voltage changes are very smooth until a cloud comes along, causing small spikes.
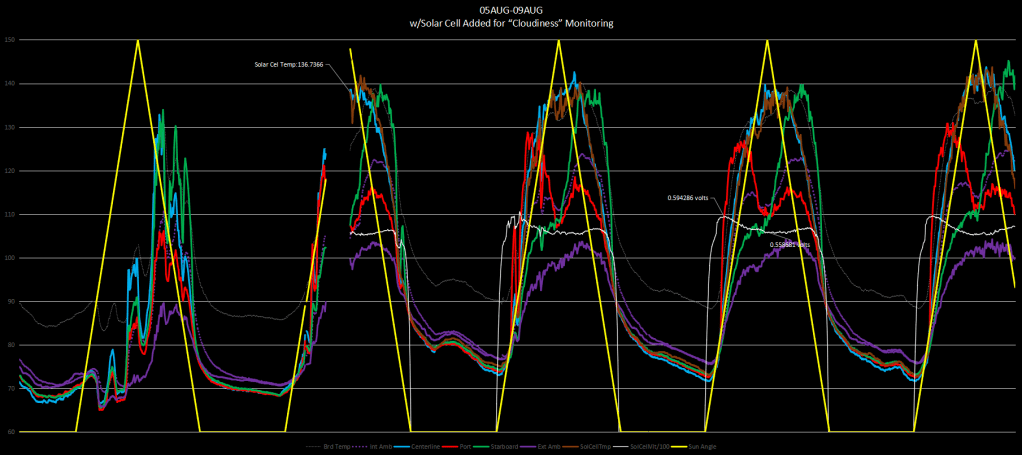
On second thought, it looks more like a molar than a butte.

That 150 degree heat on the roof and West side is just way too much. See y’all next week when we do something about that West side. I’ll try not to make it boring. After all it’s about temperatures. I’ll tell it like a story….
A West Side Story
😉
