Let it Ride
Just like when you’re gambling we need to continue on our course, gathering info, and letting it “Ride”. So…enjoy the charts, and let us know your thoughts and theories based on the data as it comes in.

After a few more days of data, and a couple forced resets because the Beagle got too hot, I’m convinced the West side shade is extremely helpful. Here’s the same graph with just the exterior skin temperatures.
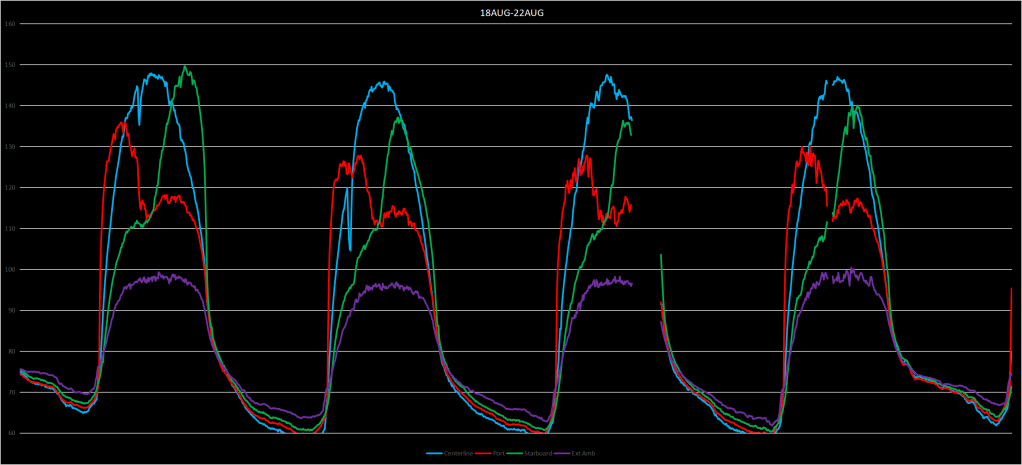
The roof is now the long tent-pole in this project!
A Tidy Ship is a Fast Ship
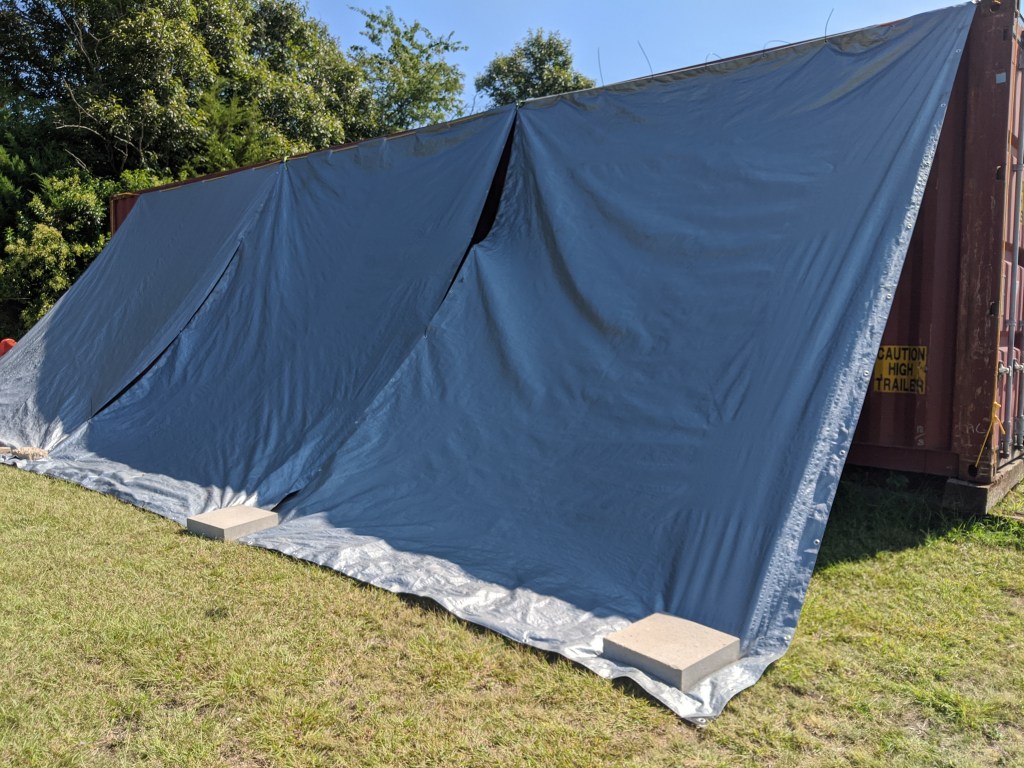
To get really good data we need a really tidy solution. On the morning of 8/22 I zip-tied the tarps together and pulled them up flush to the roof by tying rope to the intersections of each tarp and anchoring the other ends to concrete blocks on the other side of the container. I also tightened up where they were secured to the ground with heavier blocks. Flex relief would come from the natural bowing of the tarps and the ropes holding them up. Neat, now let’s see what data we get.
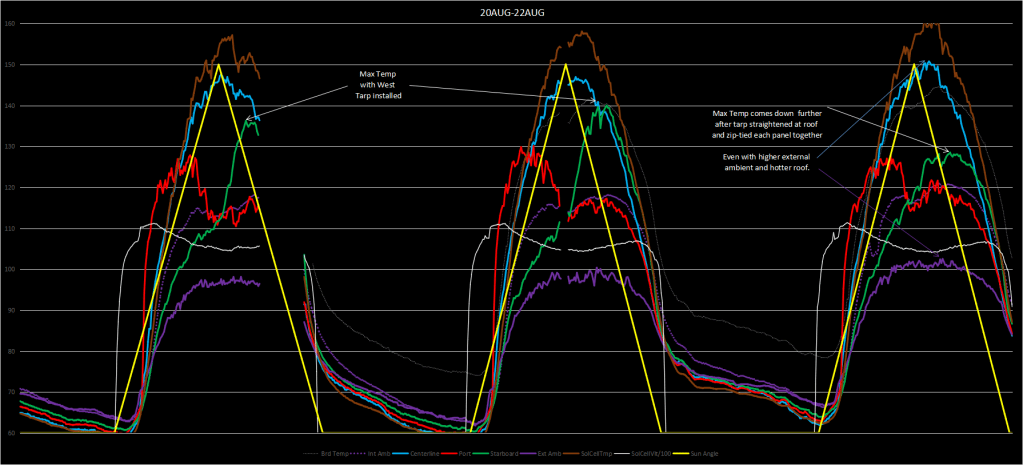
Even with higher external ambient temperatures (103F+) and a hotter roof (150F) the Starboard side got even cooler (<130) than it’s ever been before! The Starboard side almost got as cool as the Port side did from earlier that day.
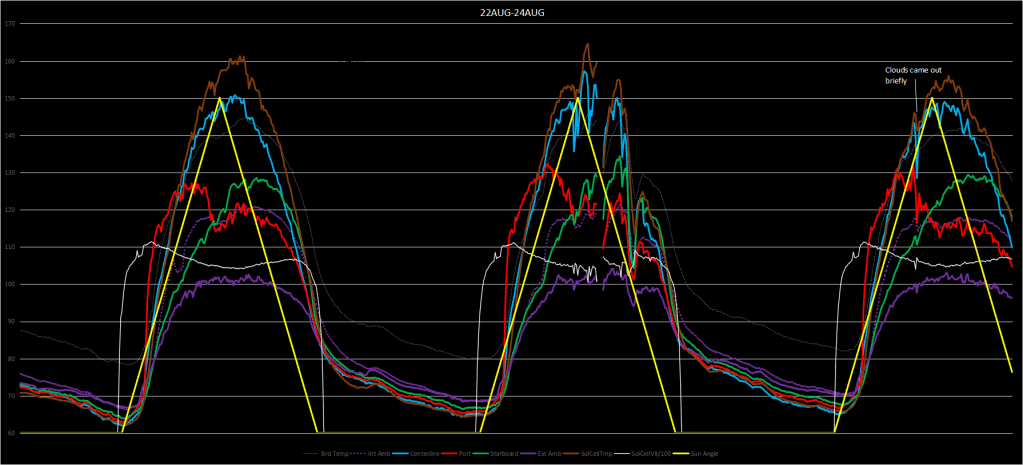
From the 22nd to the 24th we had some partly cloudy days but the threat of weather was coming soon. The morning of the 25th promised weather like we’d seen on the 16th so down came the tarps. By untying the corner and “tidy” ropes we were able to lower the tarps straight down to the ground and hold them down with a few strategically positioned concrete blocks.
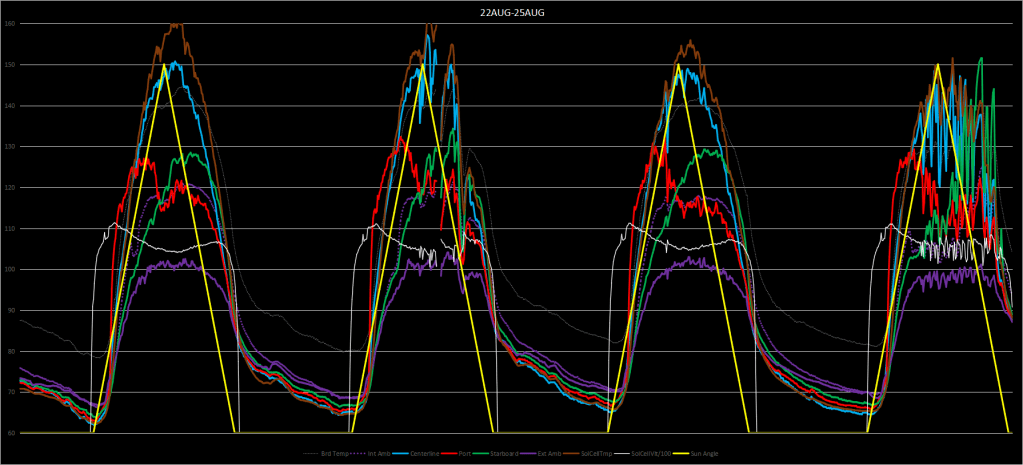
See the 25th? The weather avoided us for the most part with sun coming out in full strength between the cloudy periods. Here’s the last two days on their own graph to spread out the data making it easier to see.
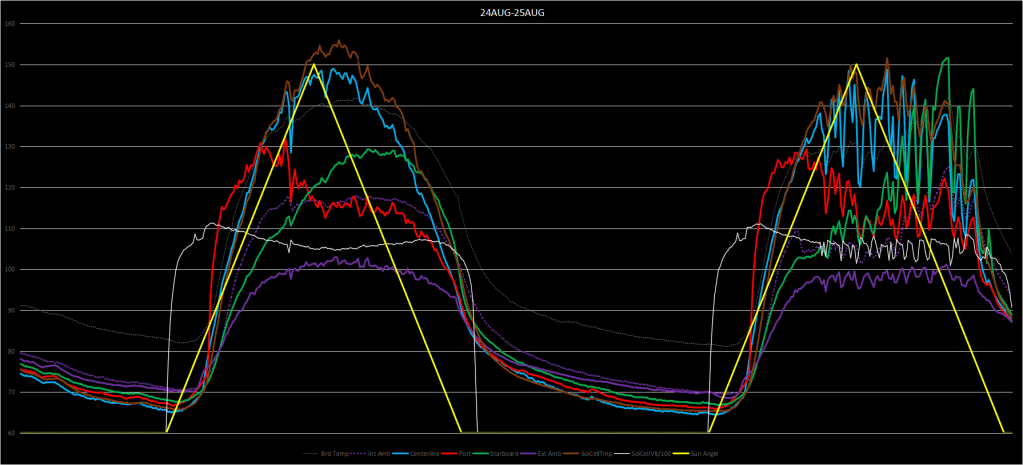
Those temperature sensors must feel like they’re on a roller-coaster.
See y’all next week!
